ggplot2: Introduction to the Grammar of Graphics
If you want to create publication-quality, aesthetically pleasing figures, or even if you just need to create a complex plot with multiple layers of information for yourself, ggplot2 is your friend. It is a powerful and flexible package, implemented by Hadley Wickham, for producing elegant graphics. It uses a systematic framework called the grammar of graphics that allows fine-grained control over how your final product looks.
You will get lots of practice using ggplot2 during this course. Here, we just review the overall framework so you can get a feel for generating meaningful graphics using this framework.
Layers
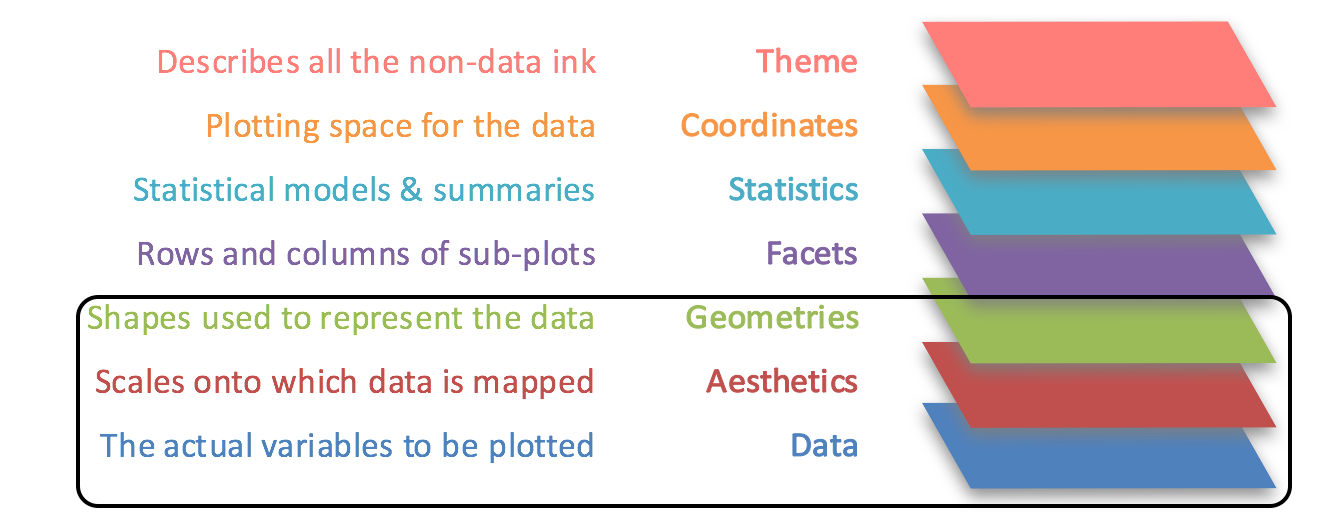
ggplot2 combines multiple layers to produce plots, each serving a particular function:
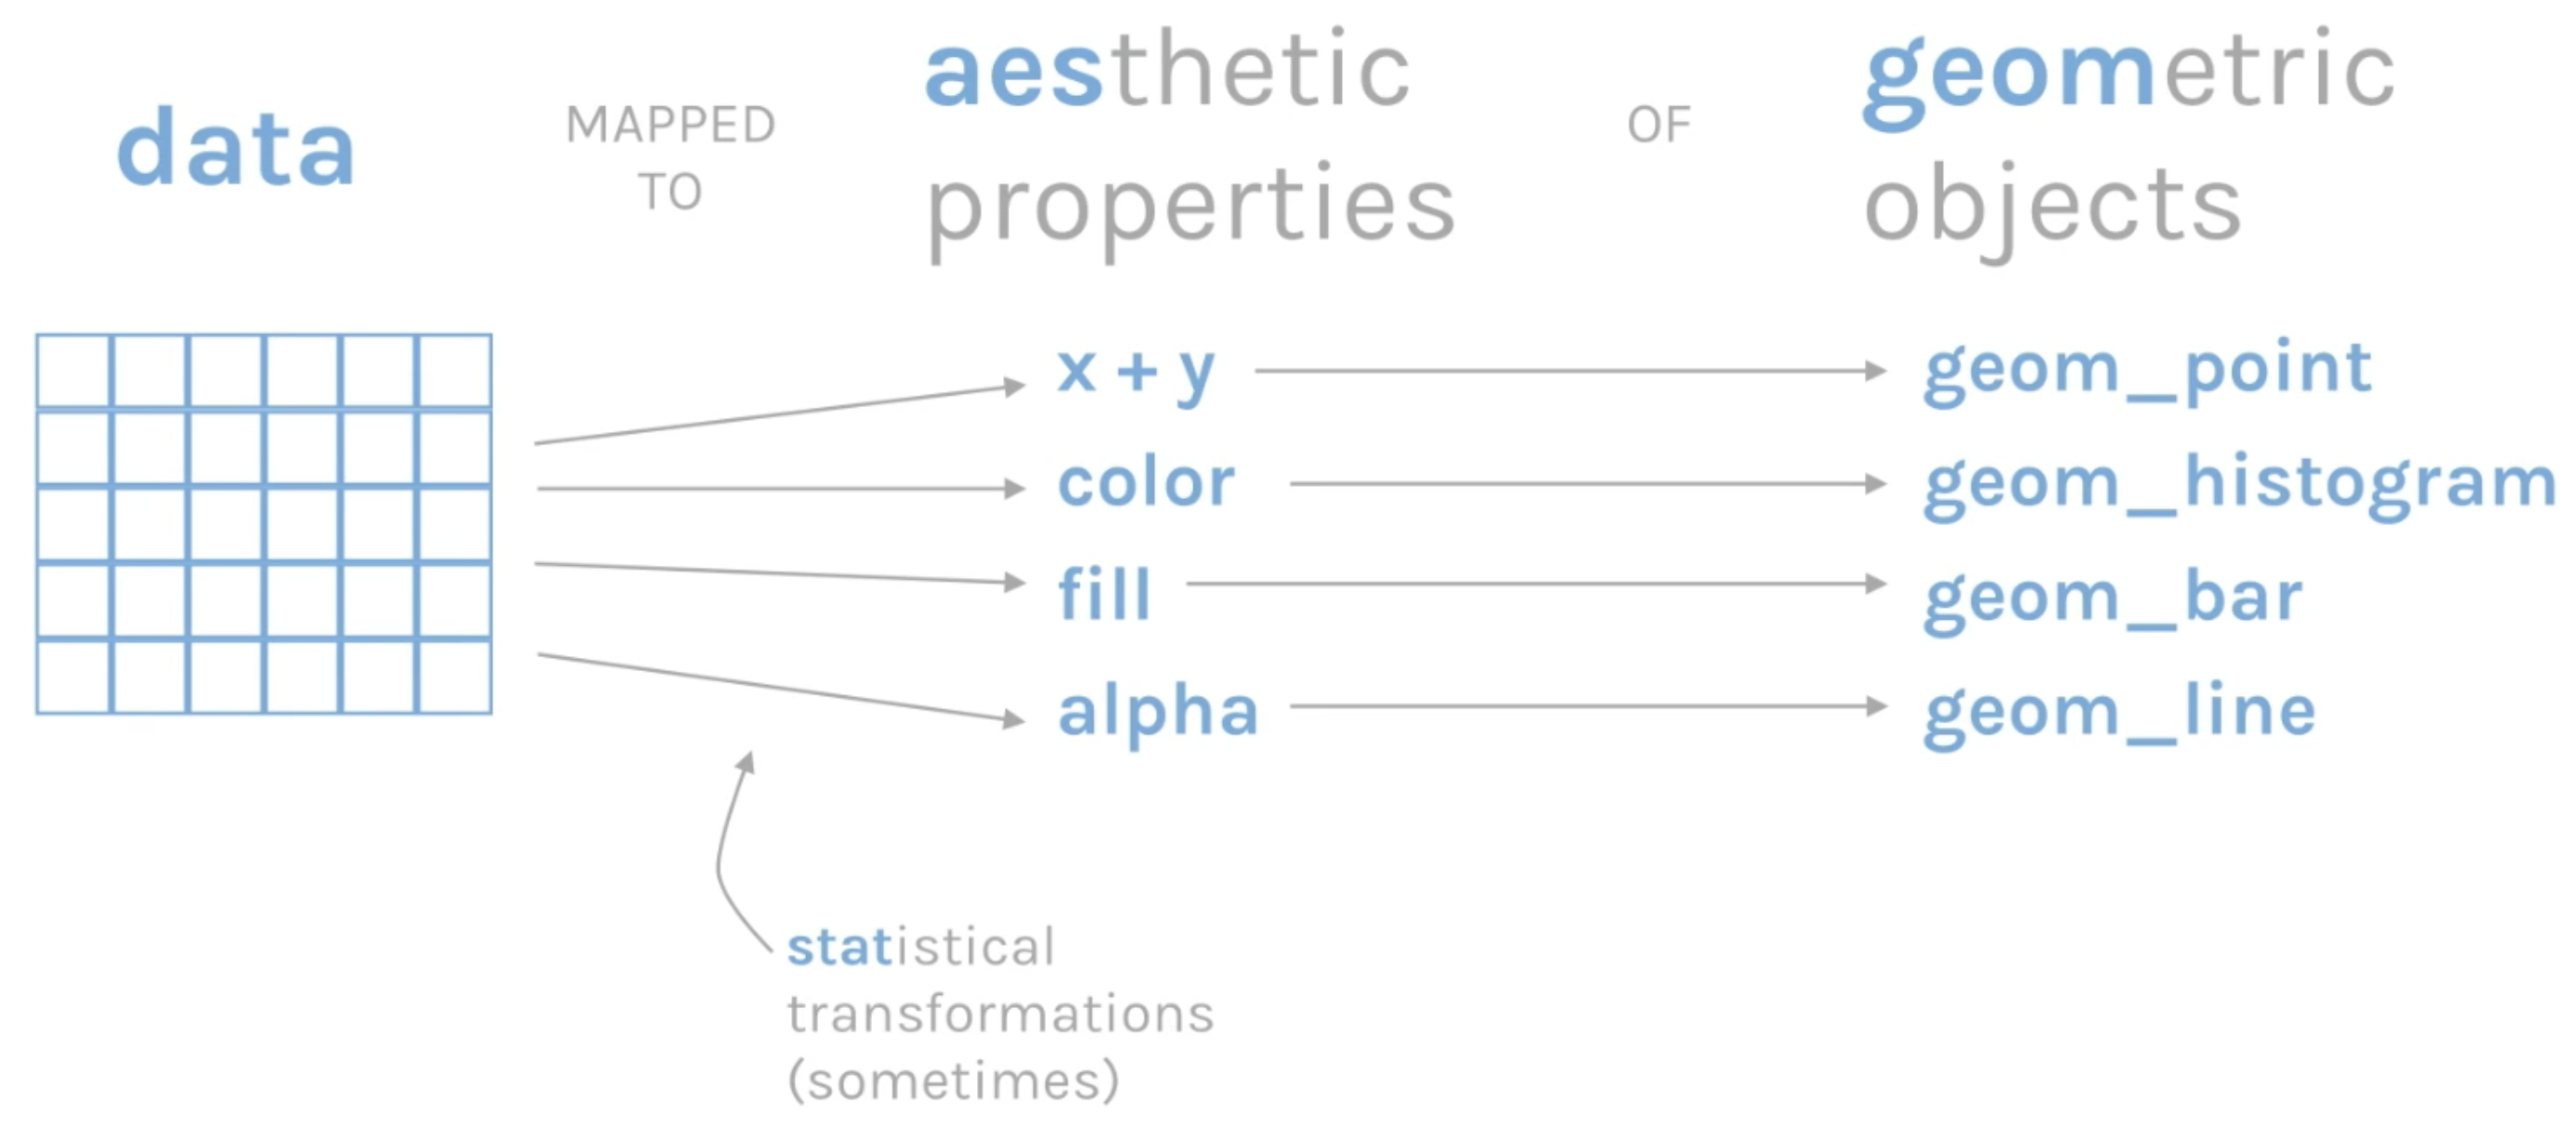
Mappings
Every ggplot2 graph is composed of three essential layers (image from the short video tutorial below):
- data
- The foundation for any visualization (a data frame).
- Aesthetics
- The scales, a.k.a. the coordinate system, onto which the data are mapped (e.g. which variables correspond to the x and y axes).
- Also used to map data onto different colors, fills, and data points
- Often used to show different subsets of data in different colors, sizes, or shapes
- Geometries
- The visual paradigm, or type of plot (histogram, box plot, line plot, density plot, scatter plot, etc.) used to display the data.
Sometimes, statistical transformations are also applied, making it very easy to rapidly model your data. Different themes may also be applied to change the look and feel of the plot.
Tutorials
-
Please take a few minutes to read through this excellent step-by-step introduction to layers, with simple examples using the famous “iris” dataset that comes with R.
-
If you like to watch videos, you may find this short video useful, which provides a high-level view of using the grammar of graphics with ggplot2 (6 minutes).
Continue on to the ggplot2 page for examples of how to make different kinds of graphs with ggplot2.